Contents
- What is covered is the Analytics Report?
- Accessing the Analytics Tool
- Switching between the Full Domain report and a Showcase Edition report
- Changing the period covered by the report
- The sections of the report
- Viewing data for a specific ePoster/stack
- Sharing the analytics report
Return to the Event Admin Support Page
What is covered in the Analytics Report?
In November 2022 we introduced the Analytics Reporting Tool into Learning Toolbox. It reports on the number of views of the ePoster/stacks in your domain. It includes historic data, so you will be able to see the views from the date when your domain was first set up.
What counts as a view? Opening the ePoster/stack counts as one view. The exploration of the ePoster/stack (clicking or tapping on a tile or opening content) does not add extra views. The views of an ePoster/stack by its editing author are not counted. If you are looking at a showcase edition report then the views of an ePoster/stack will only be counted from when it was published to the showcase.
How often is the data updated? The report data is updated every 2 hours.
Can I see the daily views on an ePoster/stack? Yes, the default view is to show you the monthly views, but you can click on the month column in the graph to drill down and see the daily views.
Accessing the Analytics Tool
You can find the link to the tool on your main Admin page.
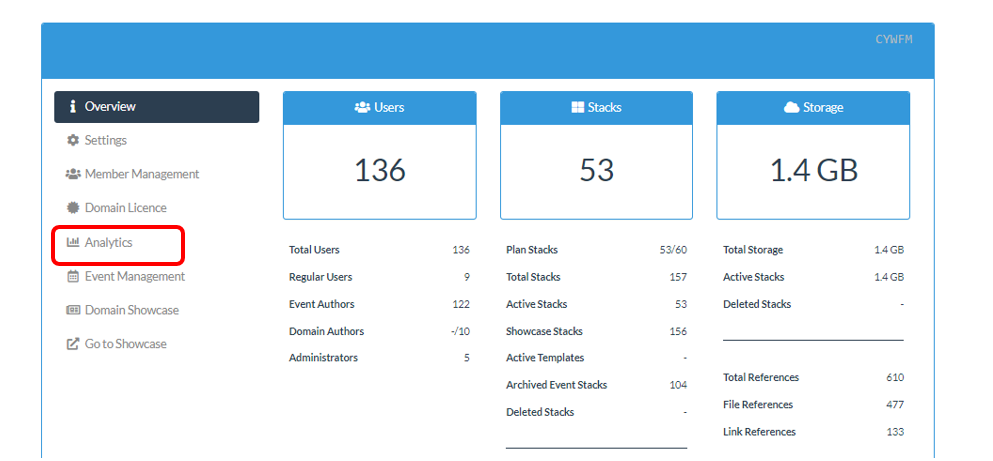
The Full Report covers all the viewable (non-Private) ePosters/stacks in your domain. If you have run multiple events then this will include ePoster stacks from all those events.
Switching between the Full Domain report and a Showcase Edition report
Often you will just want to focus on the report for a specific event (showcase edition). In that case you can simply choose, from the Report Type drop down menu, the name of the showcase edition report that you want to view.
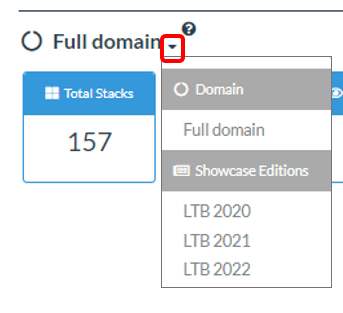
The report view will then change to show you just those ePosters/stacks that have been published to that showcase edition.
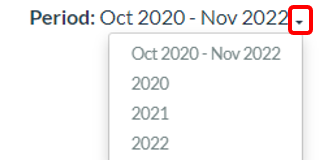
Changing the period covered by the report
You can also use the Period drop-down menu to choose the Period that is covered by the report.
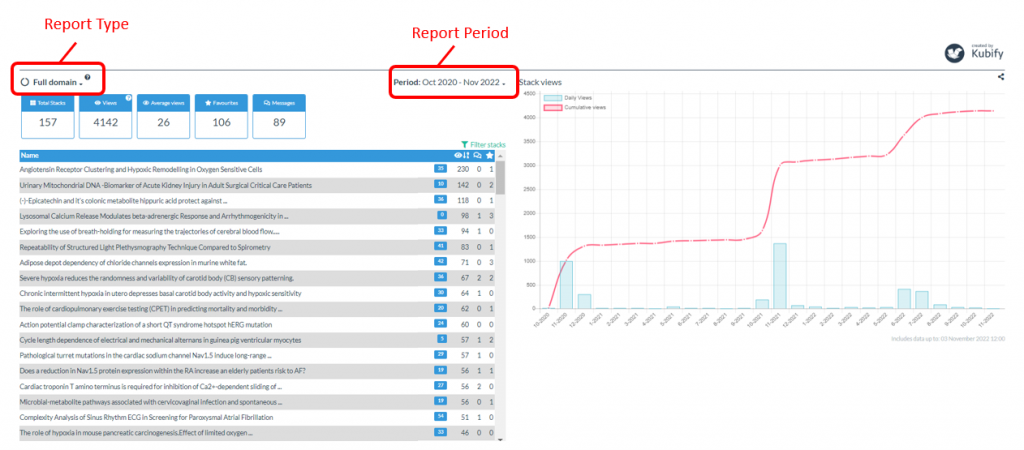
The sections of the report
The report contains three main sections: the overview, the table and the graph.
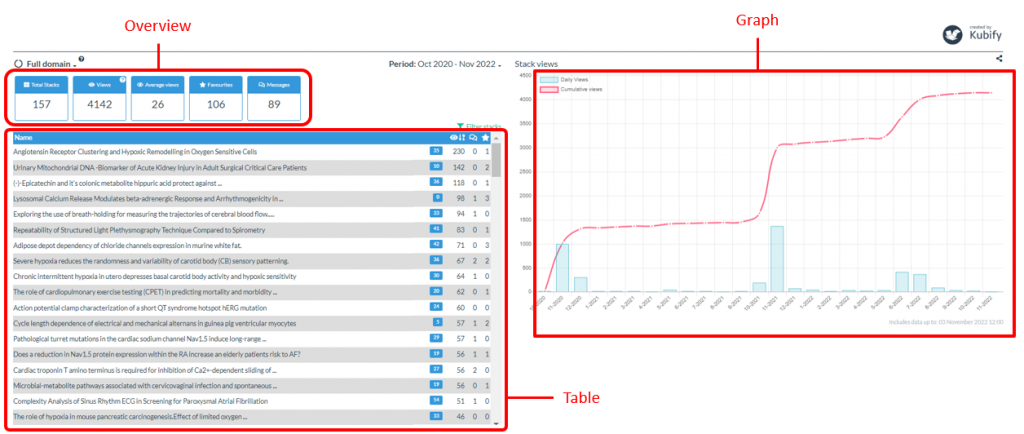
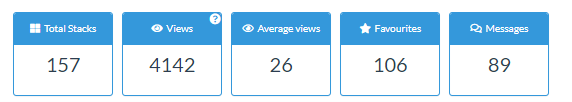
The Overview
The overview provides a summary of how many ePosters/stacks are in your current report type, how many views there have been of those ePosters/stacks in the report period, the average number of views of an ePoster/stack, the number of times these ePosters/stacks have been favourited and the number of messages posted to these ePosters/stacks.
The Table
The table lists all the ePosters/stacks in your current report. They are sorted by viewing figures by default. For each ePoster/stack the table shows the name, the invitee_code (the unique code you gave to this ePoster if it is an event ePoster), the session the ePoster was in (if it is in an event using sessions), the number of views, the number of messages and the number of times it has been favourited.
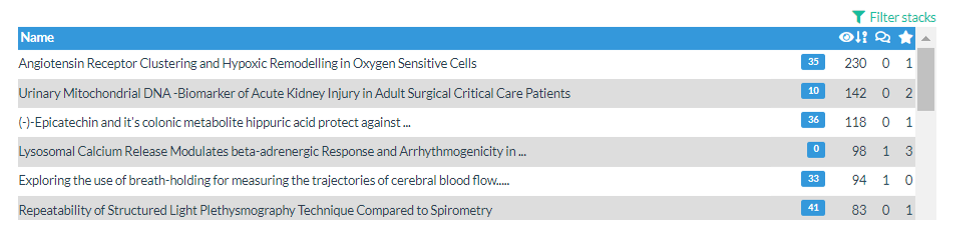
You can click on the icons (in the blue header bar) for views, messages and favourites to resort the table by that value.
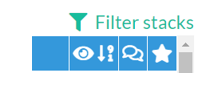
You can also filter the view by clicking on Filter stacks and typing the in some text. Then only ePosters/stacks that contain that text in their name or invitee_code will be shown.
The Graph
By default, the graph shows the monthly viewing figures of all the ePosters/stacks in your current report for your chosen Period, as well as showing the cumulative views.
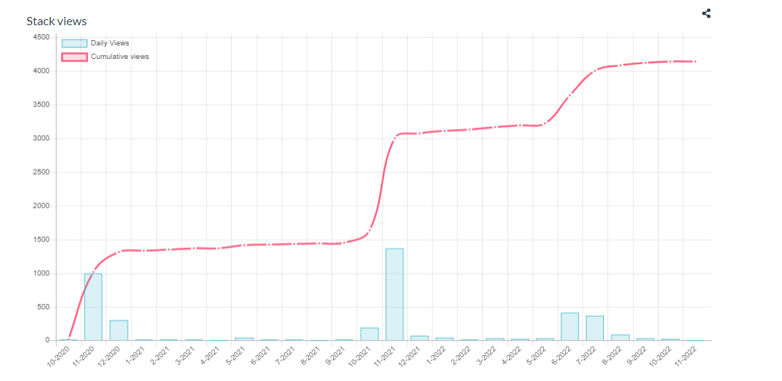
You can turn the Views and Cumulative Views on and off by clicking on their boxes in the top left of the graph.
If you want to see the daily viewing figures for a particular month then just click on that month’s bar in the graph. The graph view will then change to show the daily viewing figures for the selected month.
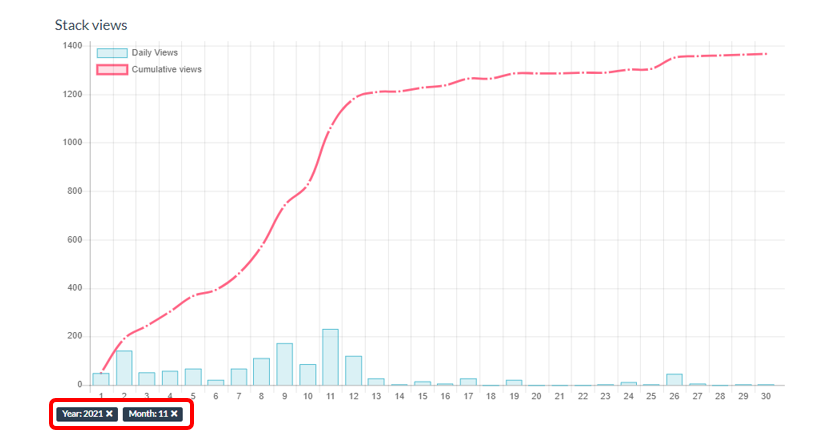
To return to your previous view you can just click on the x on the month or year filter button below the graph.
Viewing data for a specific ePoster/stack
To view the report for a specific ePoster/stack, just click on that stack’s entry in the Table. You can use the Filter View link to search and find a specific stack by typing in some text that appears in either its name or invitee_code.
The graph will update to show just the viewing figures for the selected ePoster/stack during the chosen Period.
The overview report for the selected ePoster/stack will appear beneath the graph.
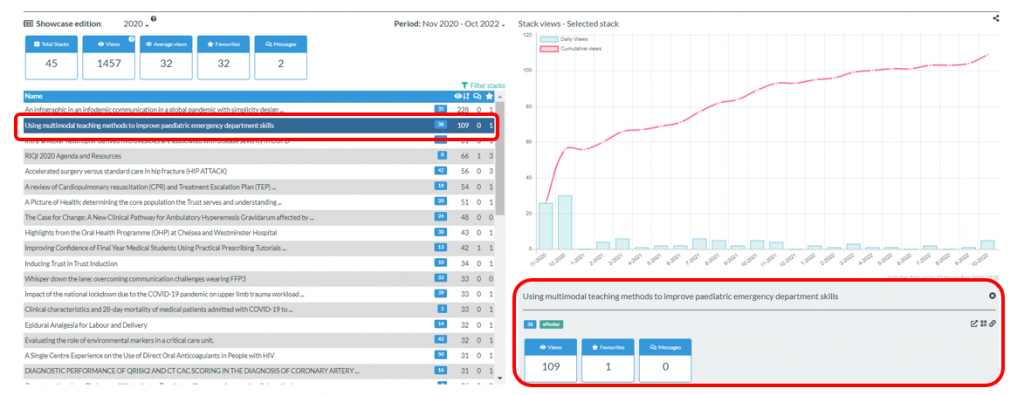
The ePoster/stack’s overview report gives you a summary of its viewing data. You can also view the ePoster/stack and copy its sharing information by clicking on the icons on the right of the report.
Sharing the Analytics Report
You can copy the link to the analytics report by clicking on the sharing icon in the top right of the report. If you then send this link to someone, they will be able to view and explore the report.